How to Build a Custom Data Visualization Software?


In the era of Big Data being the new oil, almost any company with sales history requires a new approach to decision making. Apart from the “gut feeling” a huge amount of raw data is now at hand for any business manager or for startups to take advantage of. The retail industry (both online and offline), sellers of various services, even bookstores and flower shops keep a story of each customer interaction. Now is the time to make use of this precious data. And that’s where information visualization software becomes handy.
This kind of software is mostly aimed at helping people responsible for decision making actually make better decisions. It shows a complex business situation in easy-to-understand charts of graphs. Instead of digging into multiple spreadsheets and torturing the brain to catch the hidden interconnections, all the productivity effort can be sourced to the most important part – figuring out what to do next. So, it is not surprising that the question of how to create a data visualization software is very relevant.
Data visualization software has some basic features that cover the primarily required functionality.
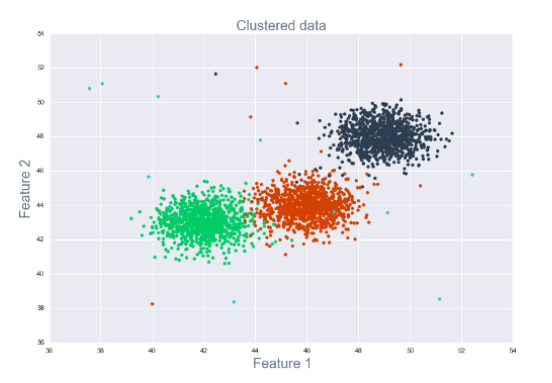
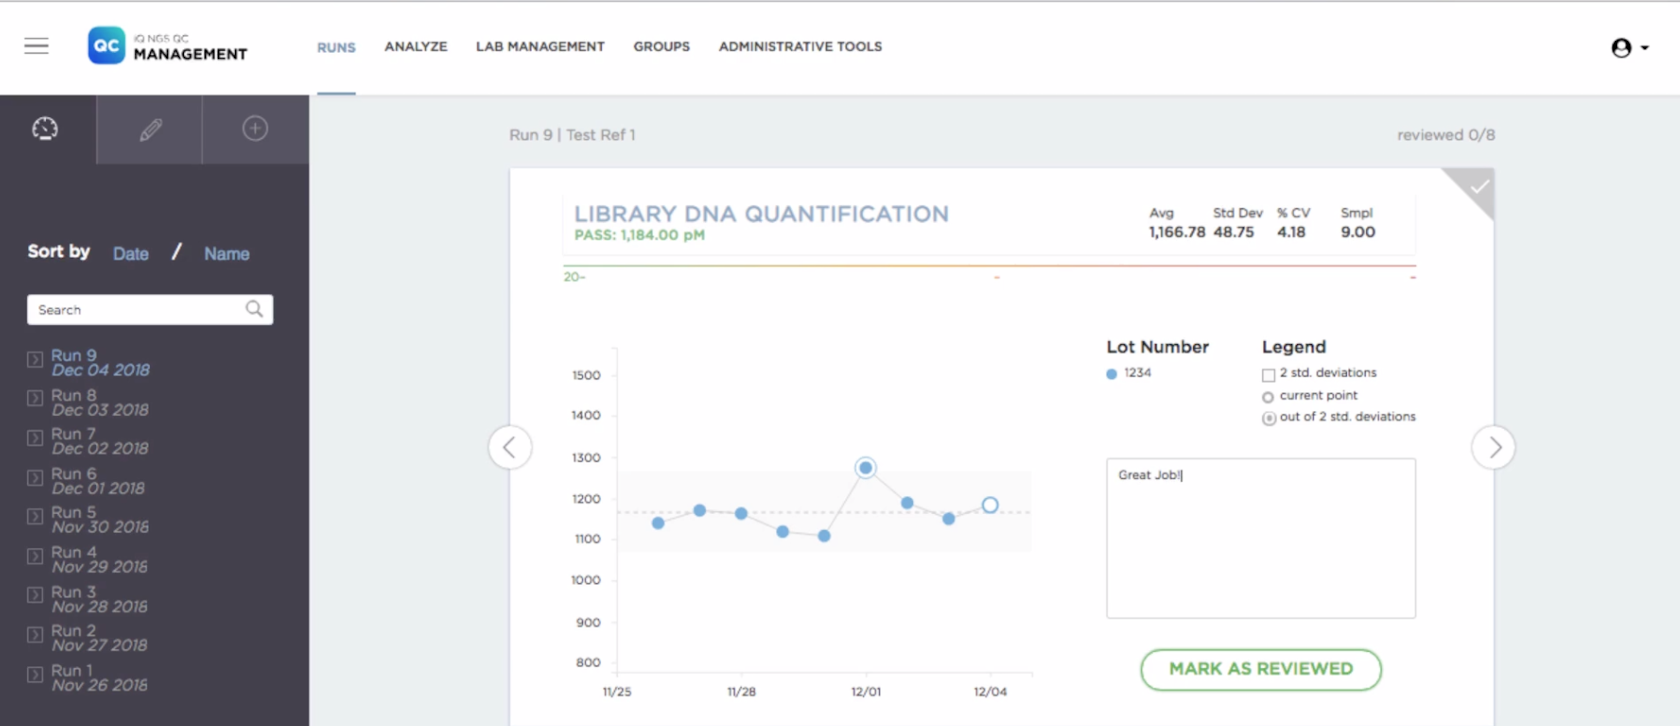
- Visual data representation: graphs, charts, tables, and other types.
- Interactive option: the opportunities for the users to make their own choice on what part of data to see and how.
- Database connection: the information for the visualization is stored on your own or a third-party server. Data visualization software needs access to that information. (Note: Read more about database architecture design).
- Alerts: in case of any important change in the structure of information the user gets to know about it asap.
- Information import and export: to add some new “intelligence data” or to take out a graph for further use.
- Data sharing: permitting or denying access to the visualized data.
How to Build Software for Data Visualization
Before you plan a data visualization software development, consider some of the ready-made solutions such as:
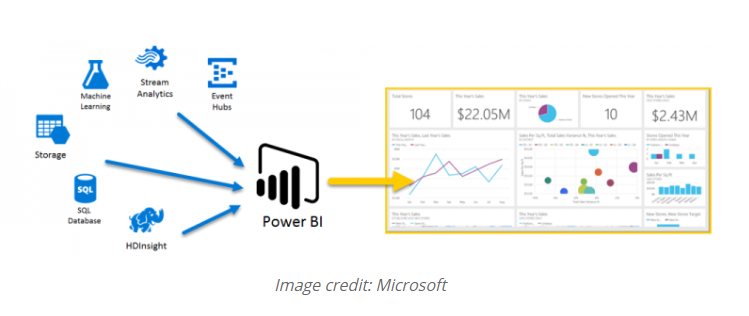
This one suggests several tools like Tableau Desktop or Tableau Data Management that have interactive dashboards for visual representation. The users can connect to various types of data either through a simple spreadsheet or an SQL database stored on a cloud server.
SAP Lumira allows creating stories with Business Intelligence data. It takes care of data security and regularly checks compliance with security regulations and industry specifics through external reviews and audits.
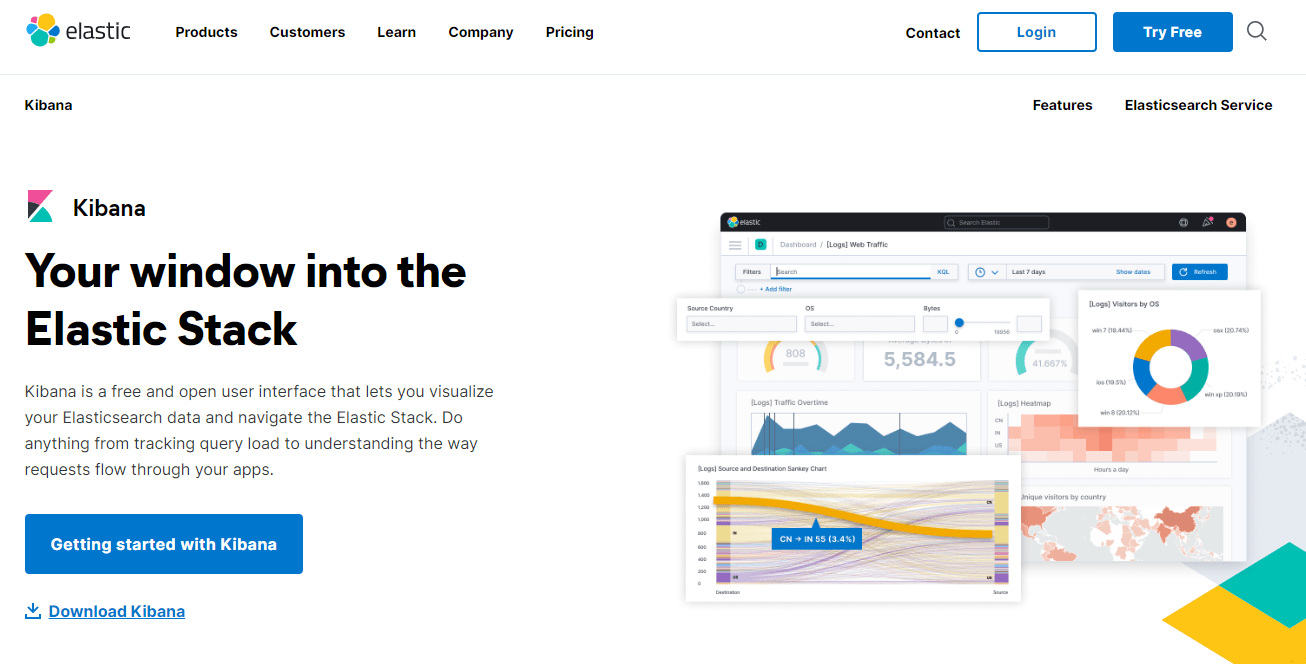
Kibana was created by Elastic search team, a special search system which can collect data from the global network for further visualization of Elasticsearch data through Kibana. With this solution you can have a one-stop-shop app: both data digging and visualization available from one vendor.
If these turn out to be not enough, then you should opt to create a custom data visualization software system for your needs. In this case, think about the final purpose of this kind of software. What data do you want to visualize? What decision do you want to make? Do you actually have the data you require? There are also a few important things to consider before you start building data visualization software.
1. Collect and prepare data
Data is the fuel for your decision-making engine. Collecting the proper high-quality data, storing and verifying it can be quite the challenge. If the information your project needs is web-based, web-crawling tools are of great use. They search and extract the data you need from the websites. Various open-source tools that can do the job for you: Scrapy, Goose Extractor, etc. Python, Ruby, and PHP are the most used programming languages for this.
Parsing has become quite a common way to collect information. There’s a lot of special software created for this purpose. The parser recognizes the patterns you assign (like names, logs, numbers, etc.), collects units of information, identifies them in a certain way and forms a database. Some parsers can distinguish which data is important and which to void. Some are not. Check this out when choosing the actual software.
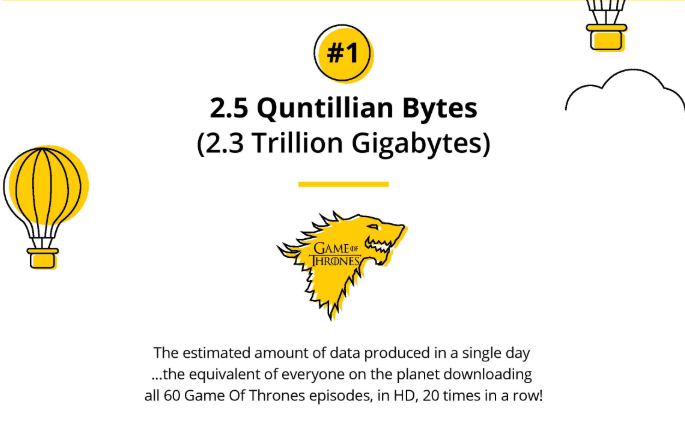
Sometimes the company already possesses all the data required: the clients’ purchase history, travel roots, loyalty programs info, transactional data, and more. Then you can move on to another step — storing the data you scraped. The volume of information may be so huge, that it would require separate storage options. Don’t underestimate the matter. Just to give you a notion about how big the Big Data is – look here.
There are several widely-used tools that can store the data required. PostgreSQL and MongoDB will help you with this challenge.
Data verification and cleaning is another important aspect. Especially if you don’t own the data but scrap it from the outer sources. This may require data structuring, noise removal, identifying missing values and much more.
If you are lucky and the data you need to visualize is already clean and structured, then skip processing and get to the next step.
2. Select information to display
Abundant data may lead to a temptation to include virtually everything into the visual representation. But for a single clearly stated purpose you don’t need everything. Moreover, a large volume of unnecessary data will only slow down the process of collecting and visualizing what you actually require. So, be as specific as possible about what you need and why for your big data visualization software.
For example, a retailer wants to find out what the main marketing channels are for further optimization of advertising costs. A diagram that shows how many clients come from Facebook or search engines might sound like a good idea. But a better option would be to show the overall revenue the retailer gets per client. And then to focus ad spending on the part of clientele that generates the most profit.
Visualization should be meaningful. The whole process has the final goal: to help make major decisions. So, identifying the actual decision under question is what should go before you start drawing any charts.
3. Select the display method
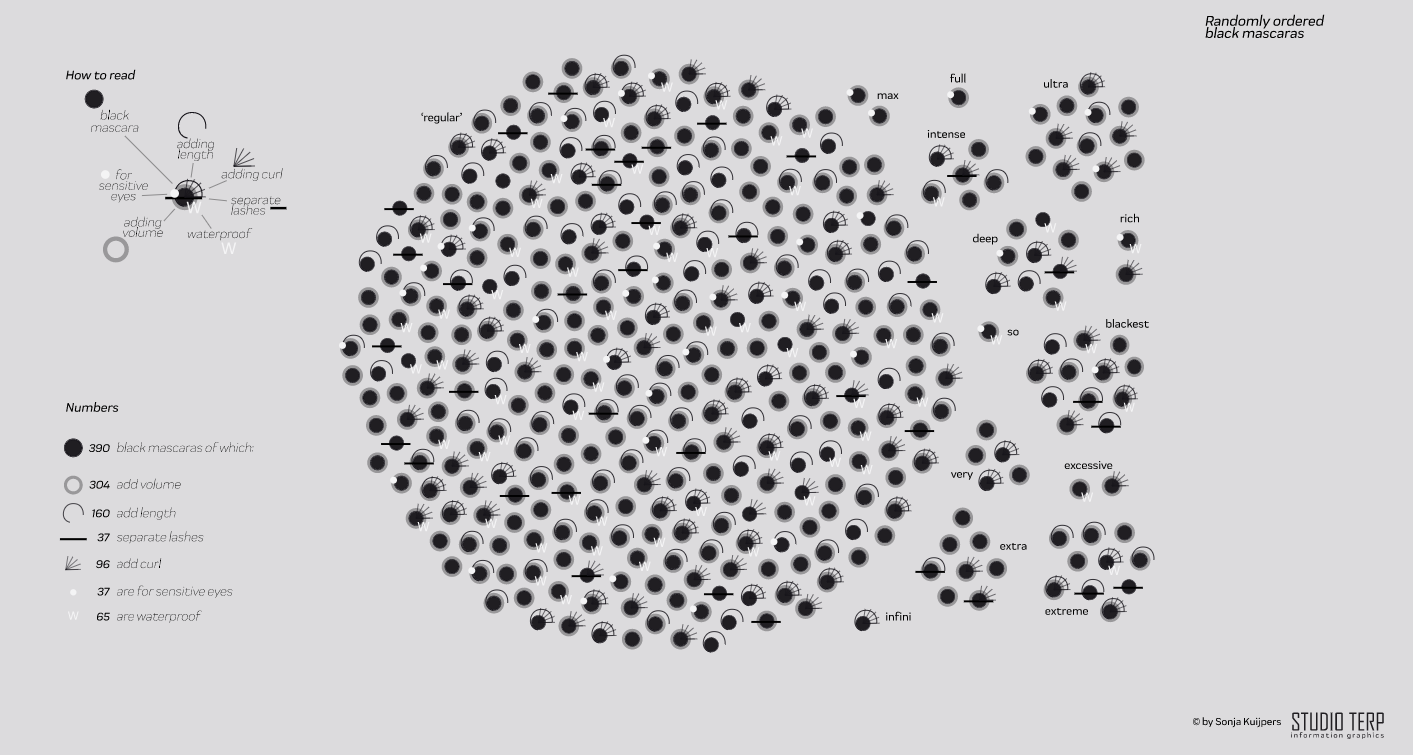
Most often regular charts or diagrams are more than enough. Just choose what fits your purpose best. But sometimes it’s better to offer a non-standard solution like animation or 3D modeling.
4. Visualization itself
The design may now appear like the easiest part of the whole process. Such tools as charts.js and Highcharts with a lot of useful customization options are enough in most cases. For a more sophisticated visualization, we recommend d3.js. This tool allows you to fully control the display of data.
We used d3 in many of our projects, including Transpose, SeraCare, Plair. It has many low-level plug-ins that allow you to automate many complex tasks such as the selection of colors depending on values, tree management or location of elements based on physical formulas.
As you can see, there are various ready-made solutions for data visualization and a lot of tools to help you customize application data visualization. If the available tools are not enough for your business needs, opt for building visualization software from scratch. In this case, you still need to start with collecting and cleaning up the data. Then, choose what and how to display, pick the right parser for your goals and type of storage.
Further, in this guide, we will share how to find the tech partners who would unite everything into one sophisticated solution for you.
How to choose the development team: in-house, freelance or agency
To develop the data visualization software, you will require a team of professionals. There are many options available, the most common of them being in-house development, hiring freelancers or outsourcing to an agency. Let’s have a closer look at each.
Creating an in-house development department
One of the obvious advantages of this option is that the team is right at hand. You have an opportunity to control the process, track progress and so on. On the other side of the coin is the cost of it. The price for having full-time developers working solely for you is quite high considering you pay for a full working day.
Another important matter is that you will have to hunt on your own those pros who can build a data visualization software system for you. Job interviews, test task evaluation and other HR routines you might not be familiar with — just a few of the tasks you’ll need to add to your duties list.
If you decide to go for this option, your team should consist of the following members:
| In-house team member | Responsibilities | Hourly rate |
| Project manager | Managing communication within and outside the team, organizing the workflow, planning tasks and resources, controlling deadline, estimating costs, risk management, etc. | $35+ |
| Back-end developer | Writing the source code, ensuring the application works smoothly and the communication between database and server is set up correctly. | $35+ |
| Front-end developer | Implementing all the visual aspects of web applications, the client-side, that users see and interact with in a browser. | $35+ |
| Designer | Creating the layout of the application | $20+ |
| Tester | Ensuring that the software meets the requirements and there are no technical issues. | $30+ |
Hiring a freelancer
This option is cheaper. A good pretext to save a bit. Again, you will have to find the freelance developers yourself and evaluate their portfolio. Next, if the freelance specialist fits your requirements, you will need a dedicated project manager. In the software developing process many matters arise, questions about the tech part, the data set, or the financial side of things and somebody has to be in constant contact with the developer. Or you will have to become that dedicated PM yourself.
Another matter to consider is communication within the project. Every now and then there would appear some troubles to discuss or the freelancer has no one to substitute him or her in case of an emergency. This may lead to considerable delays on the project. Or even postponing it if the freelancer suddenly disappears.
Outsource to agency
The third option is to outsource the web-based data visualization software development to an agency. An immediate perk— the team is already there. You’re hiring a wholesome unit, not individual team members who have never met each other. The professionals have already been handpicked by the agency.
An agency usually has relevant experience. They even might have already done a similar project. So, you will receive best practice and expertise.
This option seems more expensive than hiring a freelancer but it’s certainly a safer one. It can also be less costly than the in-house option. You only pay for the actual hours the people involved spent on a task instead of paying for the full-time employment of an in-house team.
Granted, you still run the same risks with the broken deadlines or the level of the quality you might receive. Hence, the wise choice of an agency is important. Pay attention to the company’s experience, the type of projects within the portfolio, the technology stack they use, how they treat you starting from the very first meeting.
If your research doesn’t provide a clear picture of how to approach a project, don’t hesitate to contact the agency and find out everything you need about how to create the data visualization software. Your best decisions are worth this effort. (Note: Read also why should pay attention to MVP development company).
Wrap Up
Proper data visualization can boost your business and enhance business decisions. The first thing to ask yourself is why you require the visualization itself. And what kind of information you need to achieve your goal. Then you can start parsing data from the web or prepare the data you own from previous years of your company activity. Once you collect the data, clean and structure it, choose the method of displaying it, you can move on to visualizing the data.
The standard open source solutions are often enough for general purpose inquiries. But in case you need a customized product, opt for building your own data visualization software. In-house developers, freelancers or an experienced software development agency can take the technical part and provide you with the optimal solution.
And don’t hesitate to ask more questions on how to build a data visualization tool! Experienced developers can advise you on the features required or the cost to develop the data visualization software. Working with a large amount of data is a real challenge. So, it’s wise to learn as much as possible before you start planning your database visualization software development.
Subscribe for the news and updates
What is the future of CRM? Learn what trends customer relationship management systems have to follow to be relevant in 2023
Learn how custom virtual classroom software development can improve online teaching and benefit your business.
Read about software development time estimation and the approaches we use to estimate tasks in our company
Minimal Viable Product is almost a must-have for a startup. It can help you persuade investors to finance your new project, obtain real feedback and not waste a fortune. Though development costs vary greatly, this article gives you a roadmap to figure out your MVP price.
Wondering about the difference between in-house vs. outsourcing software development? ✓Read this article to get more details now!

Find out how to build a project management software that’s right for you. Plan the most important features and learn how to avoid common mistakes.