

At Gearheart, we noticed that the number of hours it takes to complete a task of a certain size depends on:
- the project to which a task belongs;
- the project readiness stage;
- the specific developer working on a task (since different developers complete tasks of the same size at different speeds).
That’s why we created a system that predicts the number of hours needed to get the task done based on the three statements mentioned above.
Here is what the prediction looks like in our interface:
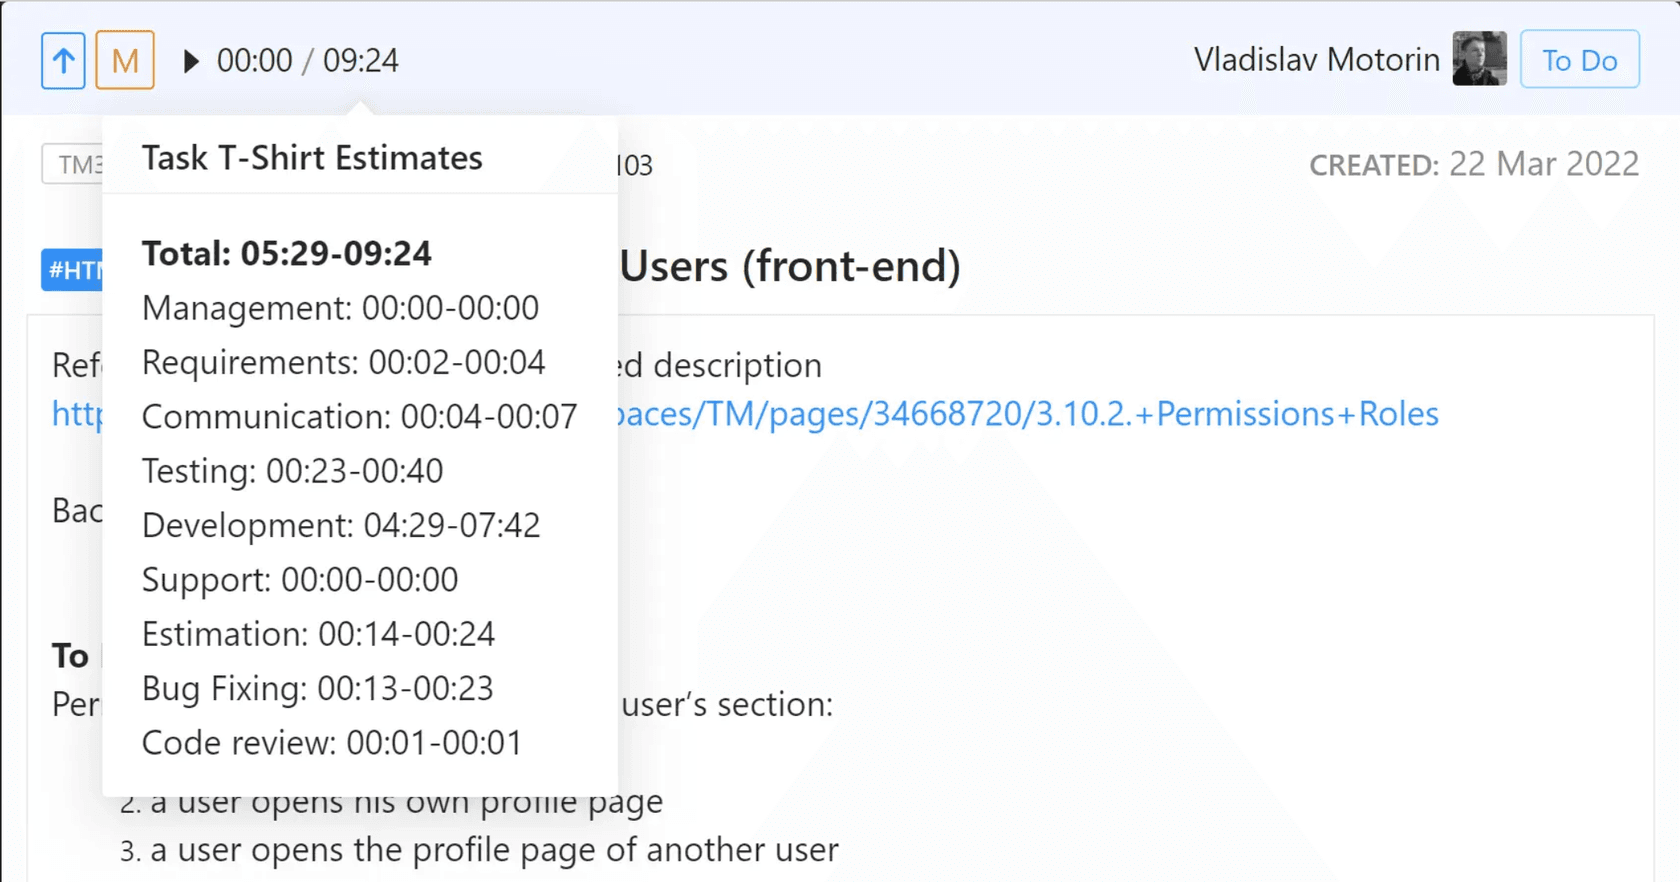
We’ve just set the M-size to the above task and assigned it to Vladislav Motorin.
According to the system, he can spend a maximum of 9 hours 24 minutes to complete the task and a minimum of 5 hours 29 minutes.
In addition, you can see a breakdown of spent time estimations by activities.
General Information
We recalculate task size estimates every time the task status changes to "accepted".
Every time the status of any project task changes to “accepted”, we add this task to a tasks pool. When a new task is added to the pool, the task with the oldest date is removed from the pool. Once the new tasks pool is ready, the system will recalculate and store the new value in the database.
We always use the selection of the last 20 tasks because we want to make predictions based on the most recent data, such as the current stage of the project and the current performance of a particular developer at that particular stage of the project.
Every time any task of the project receives a new t-shirt size or a new assignee, the system takes the last calculated estimate associated with that t-shirt size from the database and shows it to us.
We do not automatically rewrite task estimates for old tasks. It’s important for us to monitor the estimates history as the project goes on.
An example of how we monitor task estimates on different stages of the project is described below:
As of February 1, 2020, the t-shirt estimates for Nikolai Budnikov at the Olivia project for M-size tasks were 3:30 - 6:20 hours (total).
Then Nikolay worked on tasks in the same Olivia project.
As of May 20, 2020, the t-shirt estimates for Nikolay Budnikov for M-size tasks were 5:30 - 8:20 hours (total).
So, we can see an increase in estimation values as the project gets older.
Default Intervals Calculation
In new projects that do not yet have sufficient data, the default task size values are taken as the basis for interval calculations. They are the following:
- "u": (0, 0);
- "xs": (0, 3600);
- "s": (3600, 3 * 3600);
- "m": (3 * 3600, 6 * 3600);
- "l": (6 * 3600, 15 * 3600);
- "xl": (15 * 3600, 50 * 3600).
The default values for new projects are divided by the type of activity with equal shares.
After there are more than 20 accepted tasks in the project with spent time >= 1 min, the average shares are calculated as follows:
- We calculate the amount of time spent on all tasks, regardless of the assignee (all assignees).
- We then calculate the percentage for each activity for each task as an average for the project.
For projects with more than 20 accepted tasks for each developer, we switch to the main logic of prediction intervals calculation.
T-shirt estimates are calculated for each task size and for each activity type separately.
The “Task Estimation in Gearheart: Activity Types (Part 1)” article describes the information about how to get the activity shares.
Example
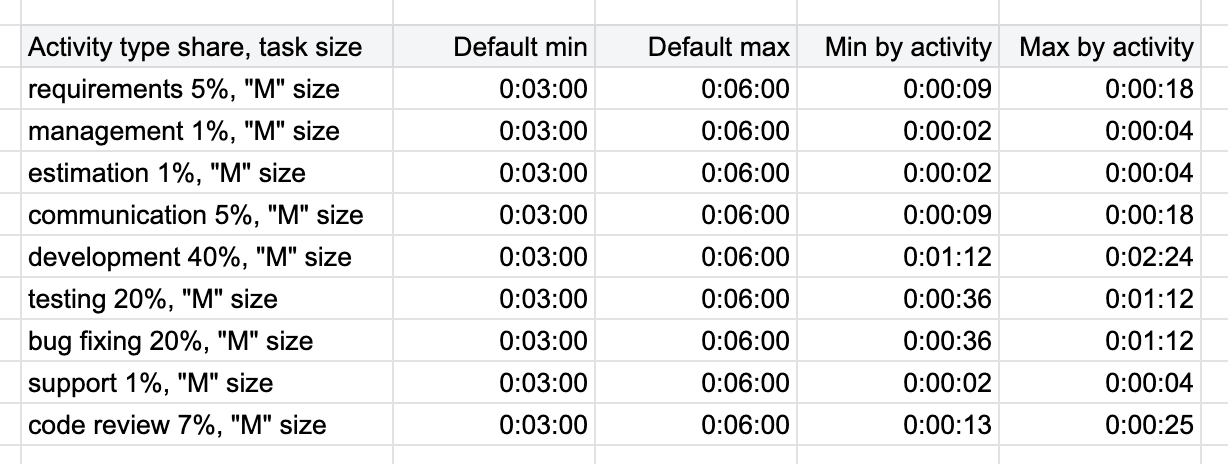
The average shares of activities for one of our projects are as follows:
- requirements 5%;
- management 1%;
- estimation 1%;
- communication 5%;
- development 40%;
- testing 20%;
- bug fixing 20%;
- support 1%;
- code review 7%.
Let's make a calculation for an M-size task:
Tasks Pool Selection
The last 20 tasks with the following parameters should be taken:
- Select a developer - data for each developer is calculated separately.
- Select a project - data for each developer is calculated within each project separately.
- Only tasks with spent time >= 1 min are taken into account. We skip tasks with less than 1 minute spent time.
- Only tasks with the “accepted” status are taken into account.
Attention should also be paid to:
- if we do not have enough tasks to complete the selection, then we should take the last 20 accepted tasks of the same project, regardless of the developer;
- if in any case, we do not have enough tasks, we should take the default values.
- if the task was transferred to another person - we would never mind this fact. We take into account only the task assignee at the moment of changing the task status to “accepted”.
- if subtasks of the task have different assignees, we still count all the spent time for the task assignee.
Average Rates Calculation
The following rules apply here:
- The total time spent is the sum of all the time spent on the 20 selected tasks, including their subtasks.
- The spent time sum is recalculated each time a new task status changes to “accepted”.
- The average rate is the sum of the time spent divided by 20.
Example:
Let's say a user has completed 20 tasks of size M. Their activity types and elapsed time are shown in the table below.
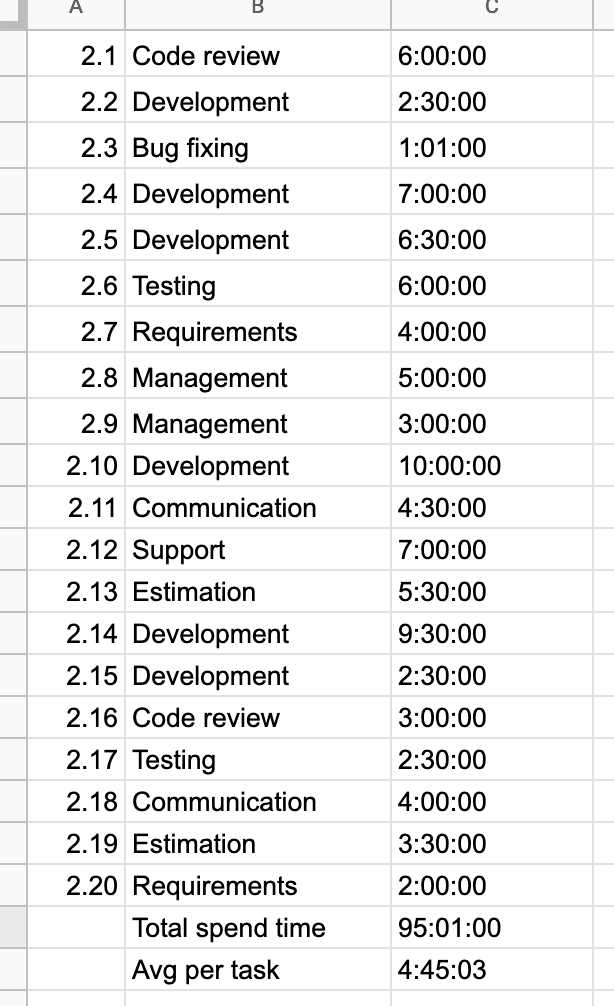
Then we calculate the Total of spent time and the average spent time per task in the tasks pool:

Activity shares in the tasks pool are calculated below (percentage and absolute value):

Deviation Range
Two things are important here:
- We use a confidence interval for a normal distribution to calculate the deviation function.
- A confidence level is 95%.
Look forward to more examples and best practices in the next article in our series.
Subscribe for the news and updates
Story points, dog or fruit scales, T-shirt sizes, dot voting, MAS, and more. There are many different task estimation techniques in Agile. In Gearheart, we went with T-shirt sizes, as we prefer short, iterative cycles to marathon planning sessions.
What you need to know to choose the right type of app between native vs. hybrid app development or just settle for a web app.

Consider these core qualities of a good software developer when hiring an outsourcing team for your project. These characteristics are the keys to good work.
One of the things we are proud about is our estimation process. Partners and clients regularly ask how we do those and how we manage to meet our deadlines, so I decided to describe our simple recipe.

For local project settings, I use old trick with settings_local file:try:from settings_local import \*except ImportError:passSo in settings_local.py we can override variables from settings.py. I didn't know how to supplement them. For example how to add line to INSTALLED_APPS without copying whole list.Yesterday I finally understood that I can import settings from settings_local:# settings_local.pyfrom settings import \*INSTALLED_APPS += (# ...)